How to Make Better Decisions with Data
One of the great promises of modern business technology is that we can measure almost anything.
Sales. Productivity. Quality. Customer satisfaction. Inventory. Labor efficiency. Website traffic. Employee turnover. Response times. Profitability.
We can put all of it into dashboards, color-code it, add trend lines, and review it in meetings.
But having more data doesn't necessarily mean we understand our business any better.
In fact, sometimes it does the opposite.
I've seen organizations struggle at both extremes.
Some businesses make important decisions almost entirely on instinct. Others produce so many reports, spreadsheets, KPIs, and dashboards that it's difficult to determine which numbers actually matter.
Neither approach works particularly well.
Data is valuable, but data by itself isn't knowledge.
And data without context can lead us to make some very bad decisions.
A Number Isn't the Same as Understanding
Let's say revenue increased 12 percent this year.
That sounds good.
But what does it actually tell us?
- Did profit increase?
- Did margins improve?
- Did we acquire more customers?
- Did existing customers buy more?
- Did we raise prices?
- Did we add employees to produce that growth?
- Did overtime increase?
- Did warranty claims increase?
- Did we take on less profitable work simply to increase revenue?
Revenue increasing 12 percent is data.
Understanding why it increased, what it cost us to achieve that growth, and whether the growth is sustainable is knowledge.
There's a big difference.
This is one of the reasons I believe leaders need to be careful about managing businesses entirely through dashboards.
A dashboard tells you what happened.
It doesn't necessarily tell you why.
Measure What Helps You Make Decisions
A common mistake I've seen is measuring something simply because we can.
Modern business systems make this incredibly easy.
An ERP system may provide hundreds of reports. A CRM can track dozens of sales metrics. Accounting software can produce financial reports almost instantly. Manufacturing systems can generate enormous amounts of production data.
Pretty soon, management meetings become exercises in reviewing numbers.
The question I think we should ask about every metric is simple:
What decision will this information help us make?
If nobody can answer that question, we should at least consider whether the metric deserves the attention we're giving it.
That doesn't mean every measurement needs to trigger an immediate action.
Some metrics exist to help us understand trends.
Others help us identify unusual conditions.
Others tell us whether a change we made actually improved something.
But there should be a reason the measurement exists.
The objective isn't to create the largest dashboard.
It's to understand the business well enough to make better decisions.
Leading Indicators and Lagging Indicators
One of the most useful distinctions in business measurement is the difference between leading and lagging indicators.
Lagging indicators tell us about results that have already occurred.
Revenue is a good example.
By the time your monthly revenue report tells you sales declined, those sales opportunities are already gone.
Customer complaints are another.
Once the complaint arrives, the customer has already experienced the problem.
Leading indicators try to tell us what may happen before the final result appears.
For a sales organization, qualified opportunities in the pipeline may provide insight into future revenue.
For a manufacturing business, equipment downtime, scrap rates, or schedule adherence may provide early warning of future delivery problems.
For customer service, increasing response times may indicate a capacity problem before customer satisfaction begins declining.
Neither type is inherently better.
You need both.
The important thing is understanding what each number is telling you.
If we manage exclusively through lagging indicators, we're often managing through the rearview mirror.
We know something went wrong, but we don't discover it until after it happened.
Averages Can Hide a Lot
Averages are useful.
They're also dangerous.
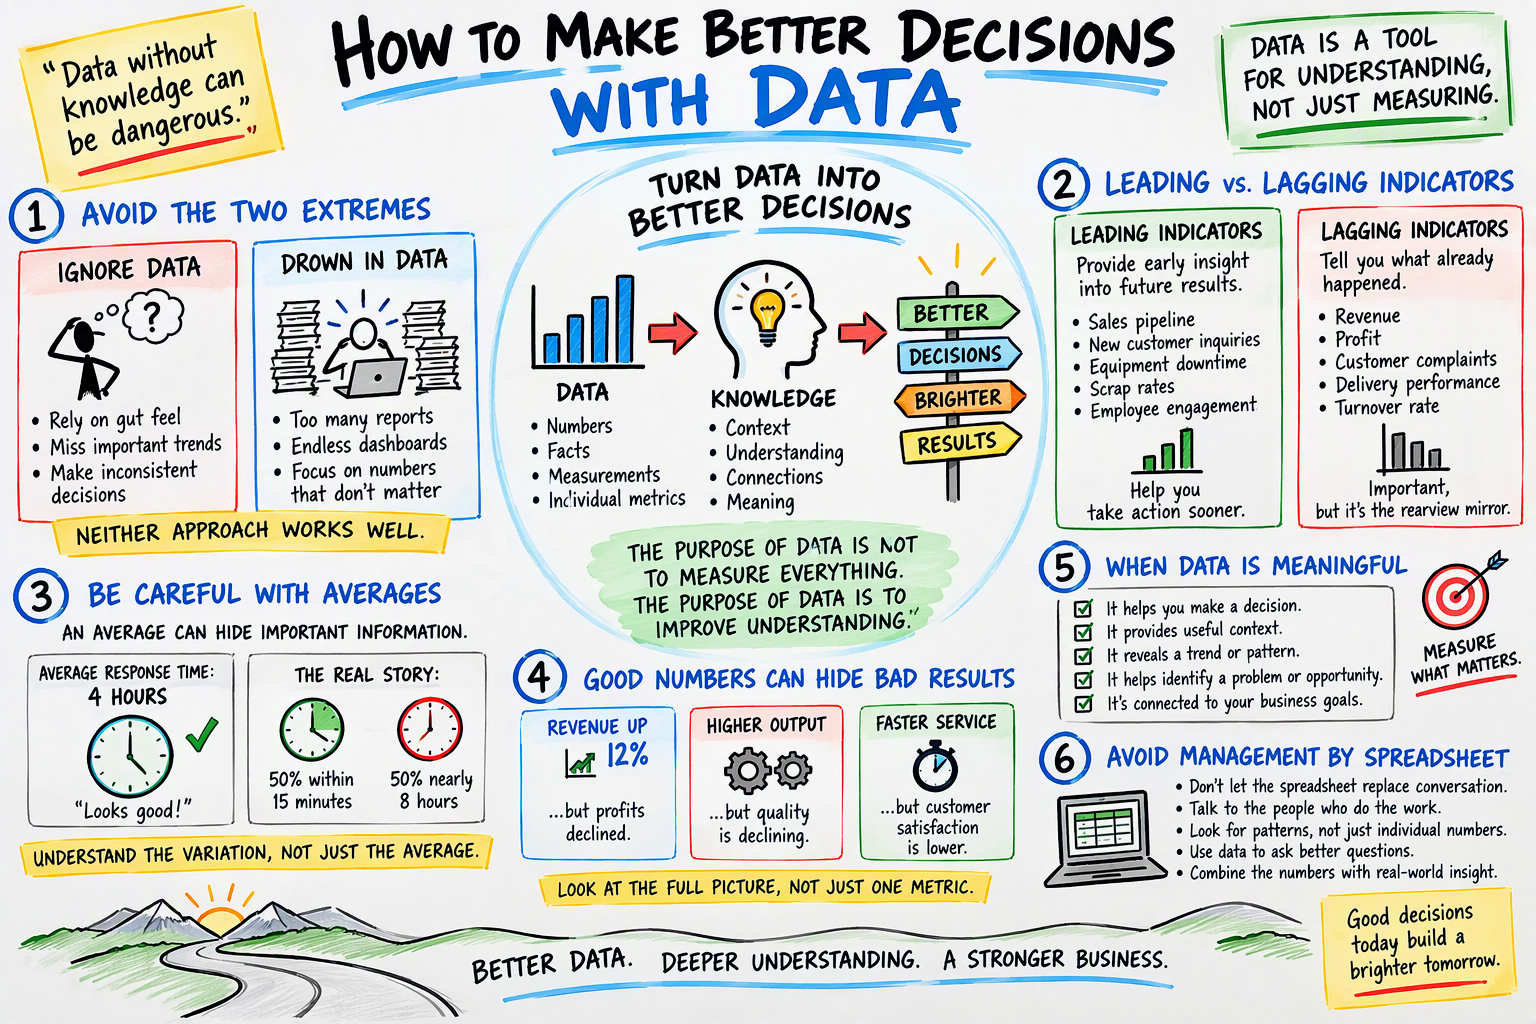
Imagine a business reports an average customer response time of four hours.
That sounds pretty good.
But averages don't tell you what happened underneath the number.
Perhaps half of the customers received a response within 15 minutes while the other half waited nearly eight hours.
The average is technically correct.
It just doesn't describe the customer experience particularly well.
The same problem occurs with production data.
Imagine two production lines.
One consistently produces about 100 units per hour.
The other alternates between 50 and 150.
Both might average 100 units per hour.
But operationally, they're very different processes.
One is predictable.
The other is highly variable.
That distinction matters when you're trying to schedule people, manage inventory, promise delivery dates, or understand capacity.
An average can tell you something useful while simultaneously hiding the information you actually need.
That's why I generally want to understand the variation behind the number, not just the average itself.
Good Numbers Can Hide Bad Results
This is another reason individual metrics need context.
Suppose production output increases 15 percent.
Management celebrates.
Then quality problems increase 25 percent.
Was the productivity improvement really an improvement?
Or suppose customer service reduces its average call time from eight minutes to five.
That's measurable progress if the goal is simply shorter calls.
But what if customer satisfaction falls because employees are rushing customers off the phone?
We improved the metric.
We made the system worse.
Sales teams can experience the same thing.
Revenue might increase while profit declines because the business is discounting heavily or accepting work with poor margins.
This is why individual metrics can be dangerous when they become targets by themselves.
People naturally respond to how they are measured.
If I tell a department that success means increasing output, I shouldn't be surprised when they focus on output.
But what happens to quality?
What happens to inventory?
What happens to maintenance?
What happens to the customer?
A good metric should help us understand performance without encouraging us to ignore the rest of the system.
Look for Patterns, Not Just Individual Numbers
This is where data becomes much more useful.
Instead of reacting every time a number moves, look for patterns.
One bad month doesn't necessarily mean your strategy is failing.
One great month doesn't necessarily mean your strategy is working.
One customer complaint doesn't necessarily mean you have a systemic quality problem.
One production record doesn't necessarily mean you've permanently increased capacity.
Business performance naturally varies.
The leader's challenge is determining when that variation is telling us something meaningful.
For example, if your average monthly scrap rate has been around 2 percent and suddenly rises to 7 percent, that's worth investigating.
But if a metric normally moves between 1.8 and 2.2 percent and one month comes in at 2.1 percent, launching a company-wide corrective action probably isn't necessary.
The number changed.
The system may not have.
Understanding that difference prevents leaders from constantly adjusting stable processes because of normal fluctuations.
Avoid Management by Spreadsheet
I like data.
I've spent a significant part of my career working with business systems, ERP implementations, operational metrics, reports, and dashboards.
I've also learned that some of the most valuable information in a business never appears on a dashboard.
You have to go look for it.
Talk to the employee who works with the process every day.
Watch an order move through the business.
Ask why someone maintains a spreadsheet outside the ERP system.
Ask customer service what customers complain about repeatedly.
Ask production where work consistently piles up.
Ask an employee what makes a task harder than it should be.
Then compare what you're hearing with what the numbers are telling you.
Data might tell you that an order took seven days to process.
The person doing the work might tell you it sat untouched for four of those days waiting for an approval.
The system gives you the measurement.
The employee gives you the context.
Together, they give you understanding.
That is much more valuable.
Start With the Question
When I'm looking at business data, I think it's useful to start with the question rather than the report.
Instead of saying, "Let's review the dashboard," ask:
- Why are margins declining even though revenue is increasing?
- Why are orders taking longer to ship?
- Why did customer satisfaction fall?
- Why is overtime increasing?
- Why is inventory growing faster than sales?
- Why are we experiencing more rework?
Now the data has a purpose.
We aren't searching through numbers hoping something interesting appears.
We're using information to understand how the business is actually behaving.
That subtle shift changes the conversation from reporting to problem solving.
Data Should Create Better Questions
There's another mistake we sometimes make with data.
We expect it to give us answers.
Often its greatest value is that it gives us better questions.
- Why did this change?
- When did it start?
- Is it happening everywhere or only in one area?
- What changed around that time?
- Is the pattern consistent?
- What other metrics moved with it?
- What do the people closest to the process think is happening?
Those questions lead us toward understanding.
And understanding is what allows us to make better decisions.
You Don't Need More Data. You Need Better Understanding.
The goal of good management isn't to measure everything.
It's to understand enough about the business to make good decisions.
Sometimes that requires a sophisticated dashboard.
Sometimes it requires looking at a trend over several years.
Sometimes it requires comparing several measurements instead of relying on one KPI.
And sometimes it requires getting out of the conference room and talking to the person doing the work.
Data should inform judgment, not replace it.
A dashboard can't understand your business for you.
That's still our responsibility as leaders.
So the next time you're reviewing a report, spreadsheet, or dashboard, don't just ask whether the numbers are good or bad.
Ask:
- What is this telling me?
- What isn't it telling me?
- What else would I need to know before making a decision?
- Do I understand why this number looks the way it does?
Because the purpose of data isn't to measure everything.
The purpose of data is to improve our understanding.
And better understanding is what ultimately leads to better decisions.